
Sorry for the long pause between posts. Life has been incredibly busy recently, and to take my mind off things, I decided to finally work on a project I started a few months back. Also, cherry blossom season just finished here in Tokyo, so enjoy this quick snap before we continue.

How did this all start?
It all started with a video by the all-famous Jeff Geerling titled “Your home’s air could be making you sick. Fight back!” describing the process he went through to try out the DIY air quality monitoring kit from AirGradient.
Being something of a hypochondriac myself, and with suspicions that my indoor CO2 levels were leading to headaches and grogginess in the morning, I decided to purchase two complete kits from AirGradient directly. I was busy enough to wait a while before starting this project, and didn’t want to keep track of 6 separate orders from various places in China.
Tokyo’s 23 wards are a massive amount of land area, totaling around 627.6 km2 of hills, flats, trains, factories, garbage processing and disposal facilities, apartment blocks and office buildings. Therefore your indoor air quality is highly dependent on what’s around you, as well as what isn’t around you (forests, rivers, etc). Of course, elements like the weather, elevation – such as what floor you live on, and such are also important.
Of course, as an AWS enthusiast, I also wanted to try some new services!
A quick note if you want to do this yourself.
The AirGradient site is extremely optimistic about the build process. You will make mistakes if you do not plan ahead, and the site’s included instructions are hard to follow for kit owners. Watch Jeff’s video and pause at each step! You are not given any spare components in the kit, so if you mess up, that’s it. You’ll need to order the spares from Amazon and wait.
Furthermore, contrary to what the site says, you probably won’t get the complete kit within two weeks. Mine finally arrived in the mail after 6 weeks, even though I’m in Japan, just a stone’s throw away! My recommendation is to order the PCBs and components from various sources, and order more than you need.
The included AirGradient platform is far from being feature complete for tinkers and didn’t ingest any data at all for me when I tried to use it. If you want any degree of customization, you’re going to want to use Grafana, and there’s going to be some trial and error to get everything up and running. Lucky for you, I’ve already done a lot of the legwork below, but you’re on your own for your setup and any personal tweaks.
Lastly, this isn’t my first rodeo with electronics. If you’re a beginner, ask a friend who has experience and contact the AirGradient team for any questions or with any issues you’re having.
If you just want air quality monitoring, money is no object and you’re okay with relying on a third-party system, there are some decent options on the market. You can look at the AirThings View Plus, which comes in at over $299.
On with the show!
Components
- At the heart of the AirGradient DIY kit is a Wemos D1 mini, an ESP8266-based microcontroller. This microcontroller is WiFi-enabled, which is of course a requirement for any IoT device.
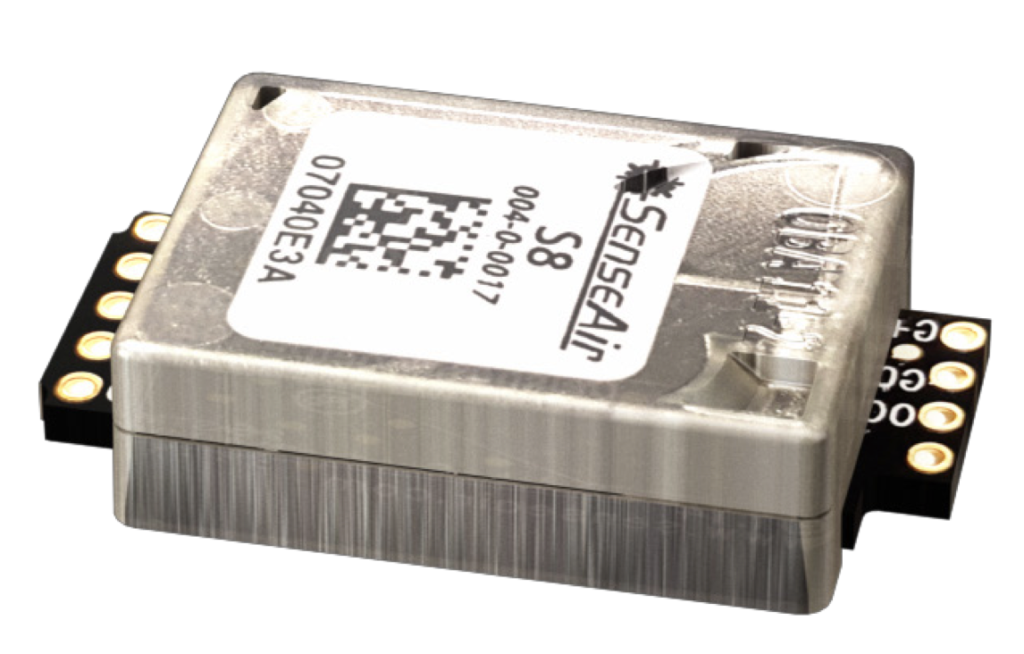
- The SenseAir S8 CO2 sensor, which is highly regarded by many in the DIY air quality space as a complete maintenance-free package. Some notes from the product documentation- sensor accuracy is within ±70 ppm (3%) thanks to individual calibration, and it has an expected operational life of 15 years. Pretty neat.
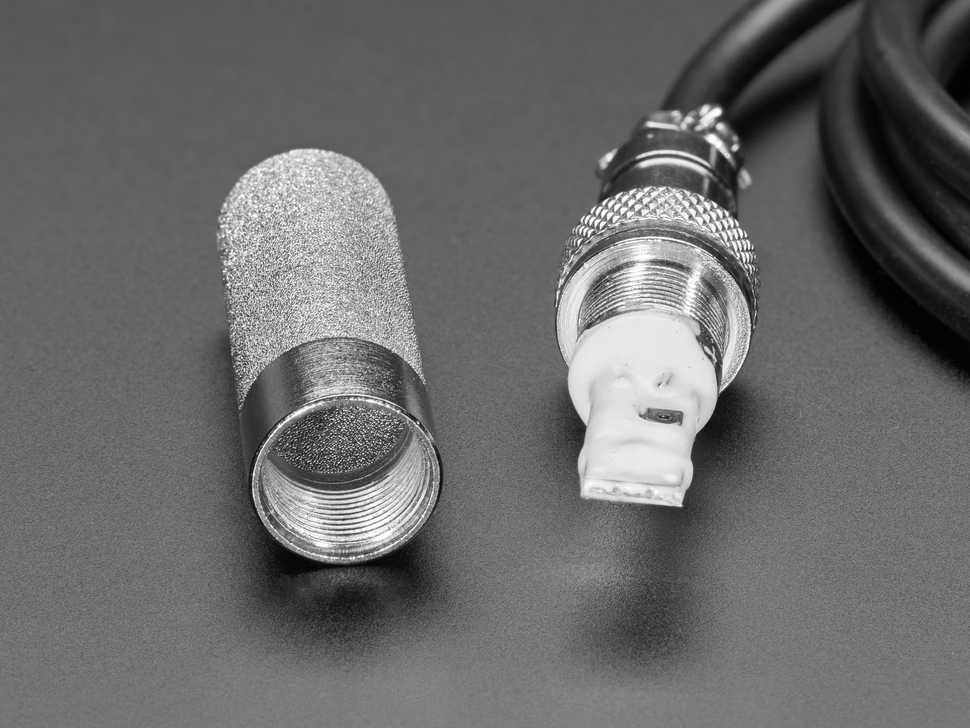
- A SHT30 Temperature and Humidity Sensor with reasonable precision of ±3 % RH and ±0.3 °C. I’ve seen some discussion around the accuracy of this sensor due to it’s proximity to other components on the board, and after some research I’ve discovered the way to get the best performance is to isolate the component with foam and a breathable casing. Companies such as Adafruit sell this component as “mesh-protected and weather-proof”. For my use-case though, it’s fine as it is.
- A Plantower PM2.5 Sensor (PMS5003) which is used by the huge project “The World Air Quality Index Project Team“. Need I say more?
Build the kit and flash the microcontroller according to Jeff Geerling’s video, and only bother with the AirGradient build instructions when you get to cutting the cable for the PM2.5 sensor as it has a decent diagram. Make sure to configure the WiFi.
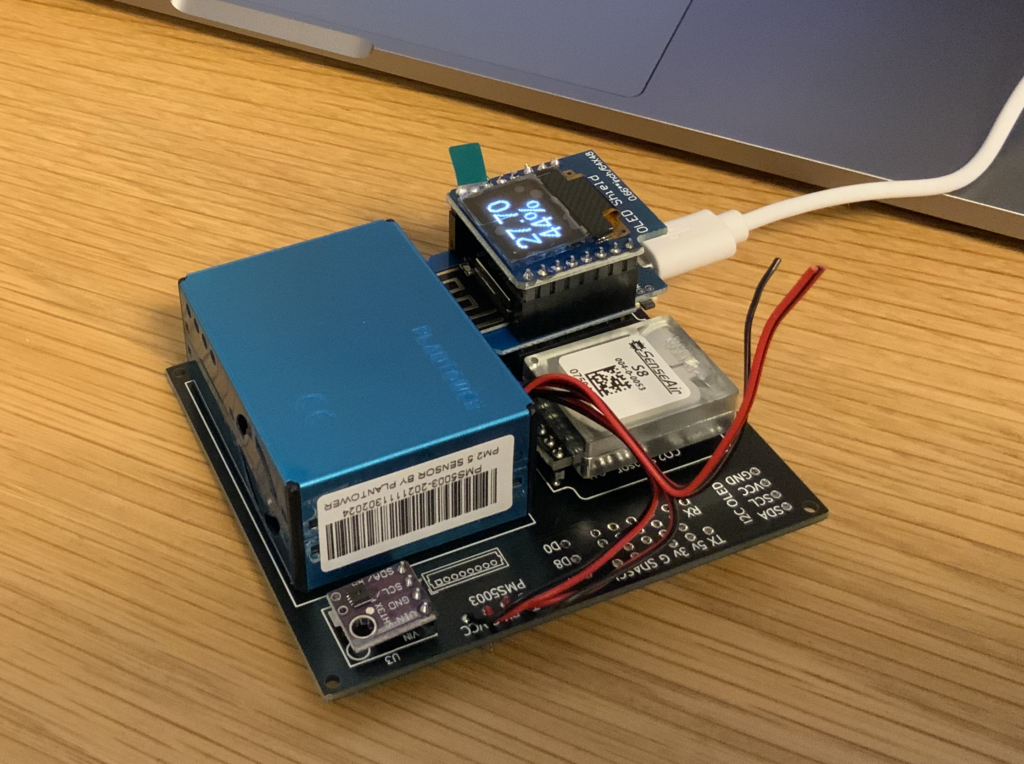
It should look something like this!
Cloud Architecture
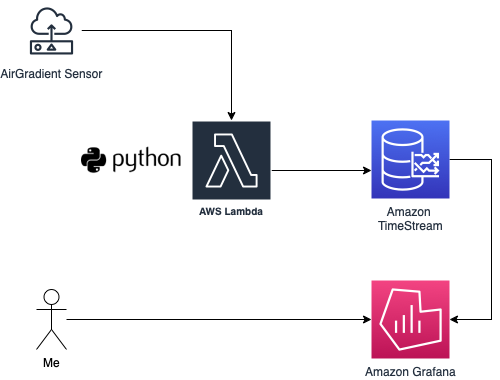
Every Internet of Things device needs a proprietary backend! Out of the box, the AirGradient Sensor connects to the AirGradient platform endpoint over HTTP (no SSL). To customize it, I had to make a few tweaks to the firmware, develop an adaptor to ingest data coming from my sensors, and write various queries to work with my dashboard.
Services
| Service | Usage | Estimated Cost |
|---|---|---|
| AWS Lambda | To receive sensor data and send it to Amazon TimeStream. | $0 (free tier) |
| Amazon TimeStream | To store sensor data captured by AWS Lambda and make it queryable from Amazon Grafana. | $0.10+/month (depending on alerting and query usage) |
| Amazon Grafana | To display sensor data stored in Amazon TimeStream. | $9/month |
You can reduce the cost of this system by replacing Amazon Grafana with any hosted Grafana, such as running it on ECS or hacking on top of Fly.io’s hosted Grafana. Luckily for me, I have some AWS credit to burn, so it’s staying on Amazon Grafana for now.
TimeStream’s billing interface sucks.
Thankfully, since it’s Serverless, Amazon TimeStream is relatively cheap. As long as I’m not refreshing the dashboard like a madman, I don’t pay a cent.
However, it’s not free, especially for queries! Turn off Grafana alerts or make them query as little data as possible to save money. Also, make sure that you specify timestamp limits on your Grafana queries using the built-in function to prevent reading the entire TimeStream table, otherwise you might get a nasty surprise on your AWS bill!
AWS, if you’re listening, Amazon TimeStream’s monitoring sucks, especially for billing calculations!
To get to near-zero cost, we can use roll-up scheduled queries. Also, you could make some tweaks to the code and replace Amazon Timestream with another time-series database such as InfluxDB. Unfortunately, thanks to Grafana Labs making query caching an Enterprise feature, query costs will be the majority of your monthly bill. A post about cost-optimising this system by using scheduled queries might appear on this blog in the future!
Why didn’t I just use Jeff Geerling’s architecture?
Jeff is famous for having a home-lab and too many Raspberry Pi 4’s. Unfortunately, due to the global chip shortage which has been wreaking havoc since 2020, the Raspberry Pi foundation isn’t shipping any RPis to consumer groups until the end of this year.
Furthermore, I don’t want to have additional physical infrastructure for this system as it degrades the user experience. It should report to a central service just like it would if I used AirGradient’s system out-of-the-box, without requiring an entire other computer to do so.
The ingestion service.
This whole project is kinda hacky as I don’t expect it to see widespread usage, so you’ll need to follow these instructions closely. On the bright side, it should stand the test of time.
- Firstly, clone this repository.
- Package and deploy the AWS Lambda function in the lambda directory.
- Go to the Lambda’s configuration and add the managed policy which allows full Amazon TimeStream access.
- Go to the Lambda’s configuration and add a function URL. It is important to make sure auth is set to NONE and no CORS is configured. This is a new feature at the time of writing, so you’ll get to experience something new!
- Save the function URL somewhere. It is your AirGradient’s ingestion service URL.
- Go to the Amazon TimeStream console in the us-east-1 region and add a database named airgradient and a table inside that named sensors.
- Your ingestion service should be ready to go!
The AirGradient.
Warning! This step presumes you have previously configured WiFi with the original firmware on your AirGradient. If you haven’t, make sure to do that first.
You’re going to want to download and flash the custom firmware located here. If you cloned the repository in the previous step, it’s in the top level folder. This was modified from the original to communicate over HTTPS. Additional logic was also added to catch additional errors to prevent microcontroller crashes.
Make sure to replace the ingestion service URL with your Lambda’s public function URL before flashing.
Plug it in and start sending some data!

Make sure to deploy it in a place with good airflow and above the ground. For example, I mounted it to my wall with double-sided tape.
Visualize using Amazon Grafana and Amazon TimeStream.

Take a breath, the hard part is over! This bit is relatively easy, but it allows us to visualize our air quality- the entire point of the project.
- Configure a new Amazon Grafana workspace with AWS SSO authentication. Enable the Amazon TimeStream integration.
- As for authentication, if you want to use SAML or Grafana on another service, the exercise is left to you.
- To add Amazon TimeStream to a custom Grafana instance, you can use this plugin.
- Log into Amazon Grafana. Configure an “Amazon TimeStream” Data Source with the correct database and table selected as default. You can select any of the expected values for the measure. If they don’t appear, you’ve configured something incorrectly or data isn’t being sent.
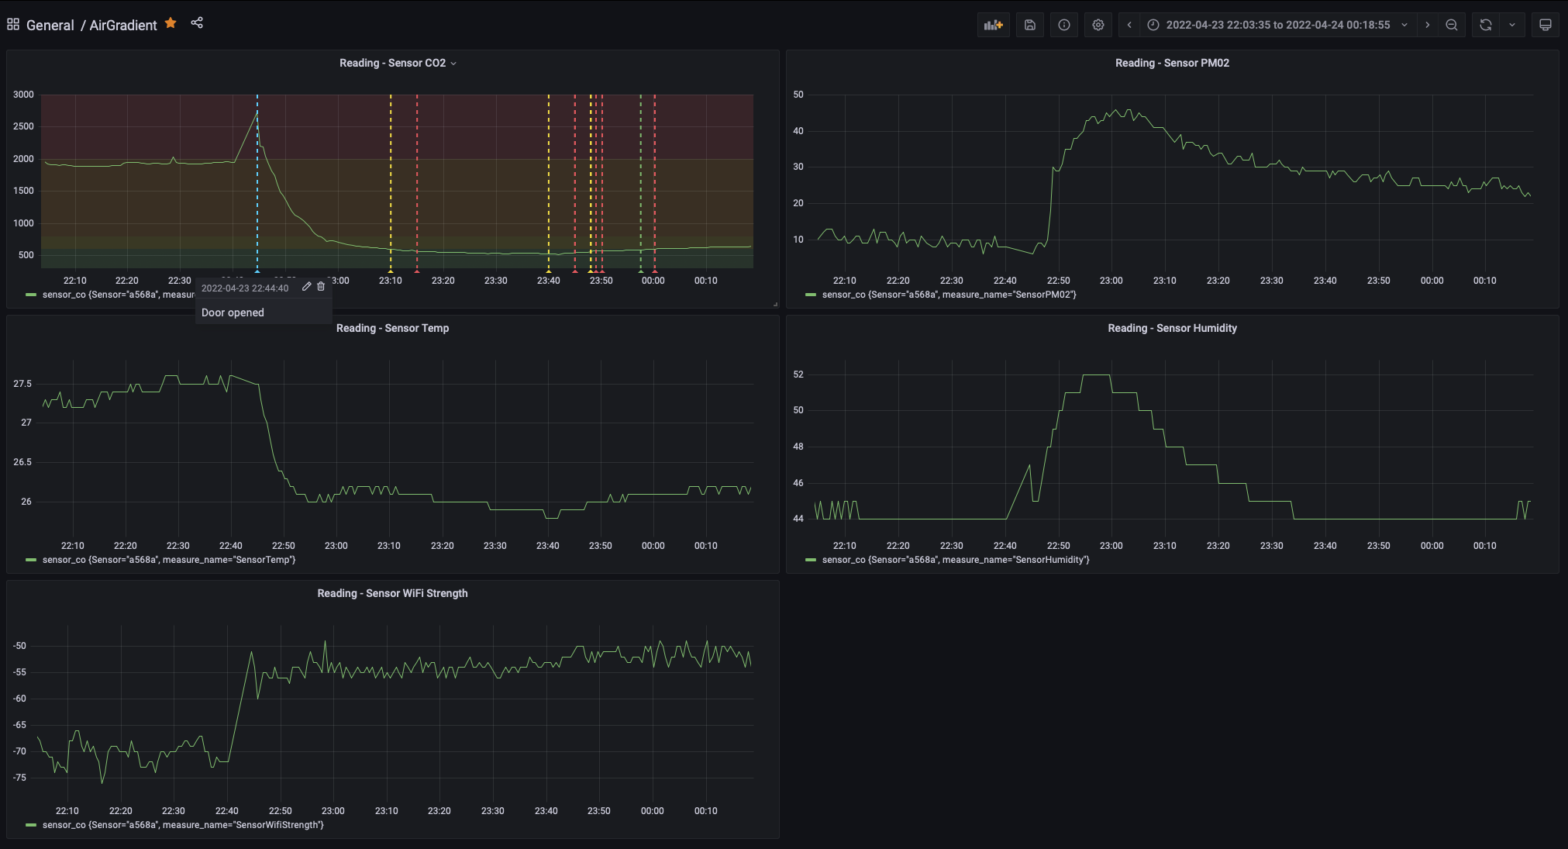
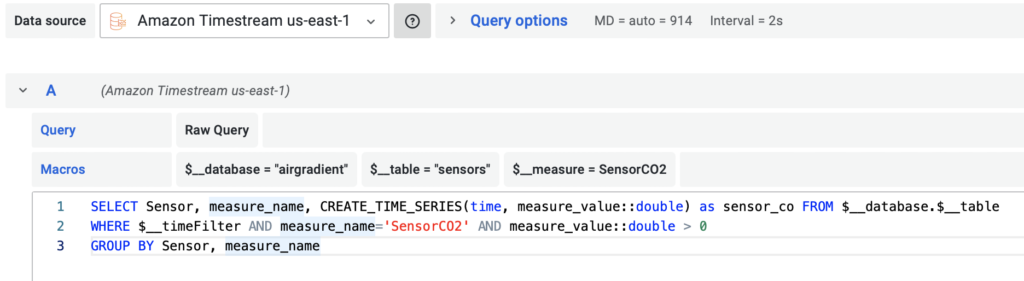
- Add a new dashboard and panel, with the following query. Make sure the correct Macros are selected!
SELECT Sensor, measure_name, CREATE_TIME_SERIES(time, measure_value::double) as sensor_co
FROM $__database.$__table
WHERE $__timeFilter AND measure_name='SensorCO2' AND measure_value::double > 0
GROUP BY Sensor, measure_name
Now you can copy and paste this for the remaining panels, replacing the ‘SensorCO2’ in the query and the measure macro with the below values.
- SensorWifiStrength
- SensorPM02
- SensorCO2
- SensorTemp
- SensorHumidity
You can also configure alerting via SNS, but be aware this comes with higher costs, so please take care!
Conclusion
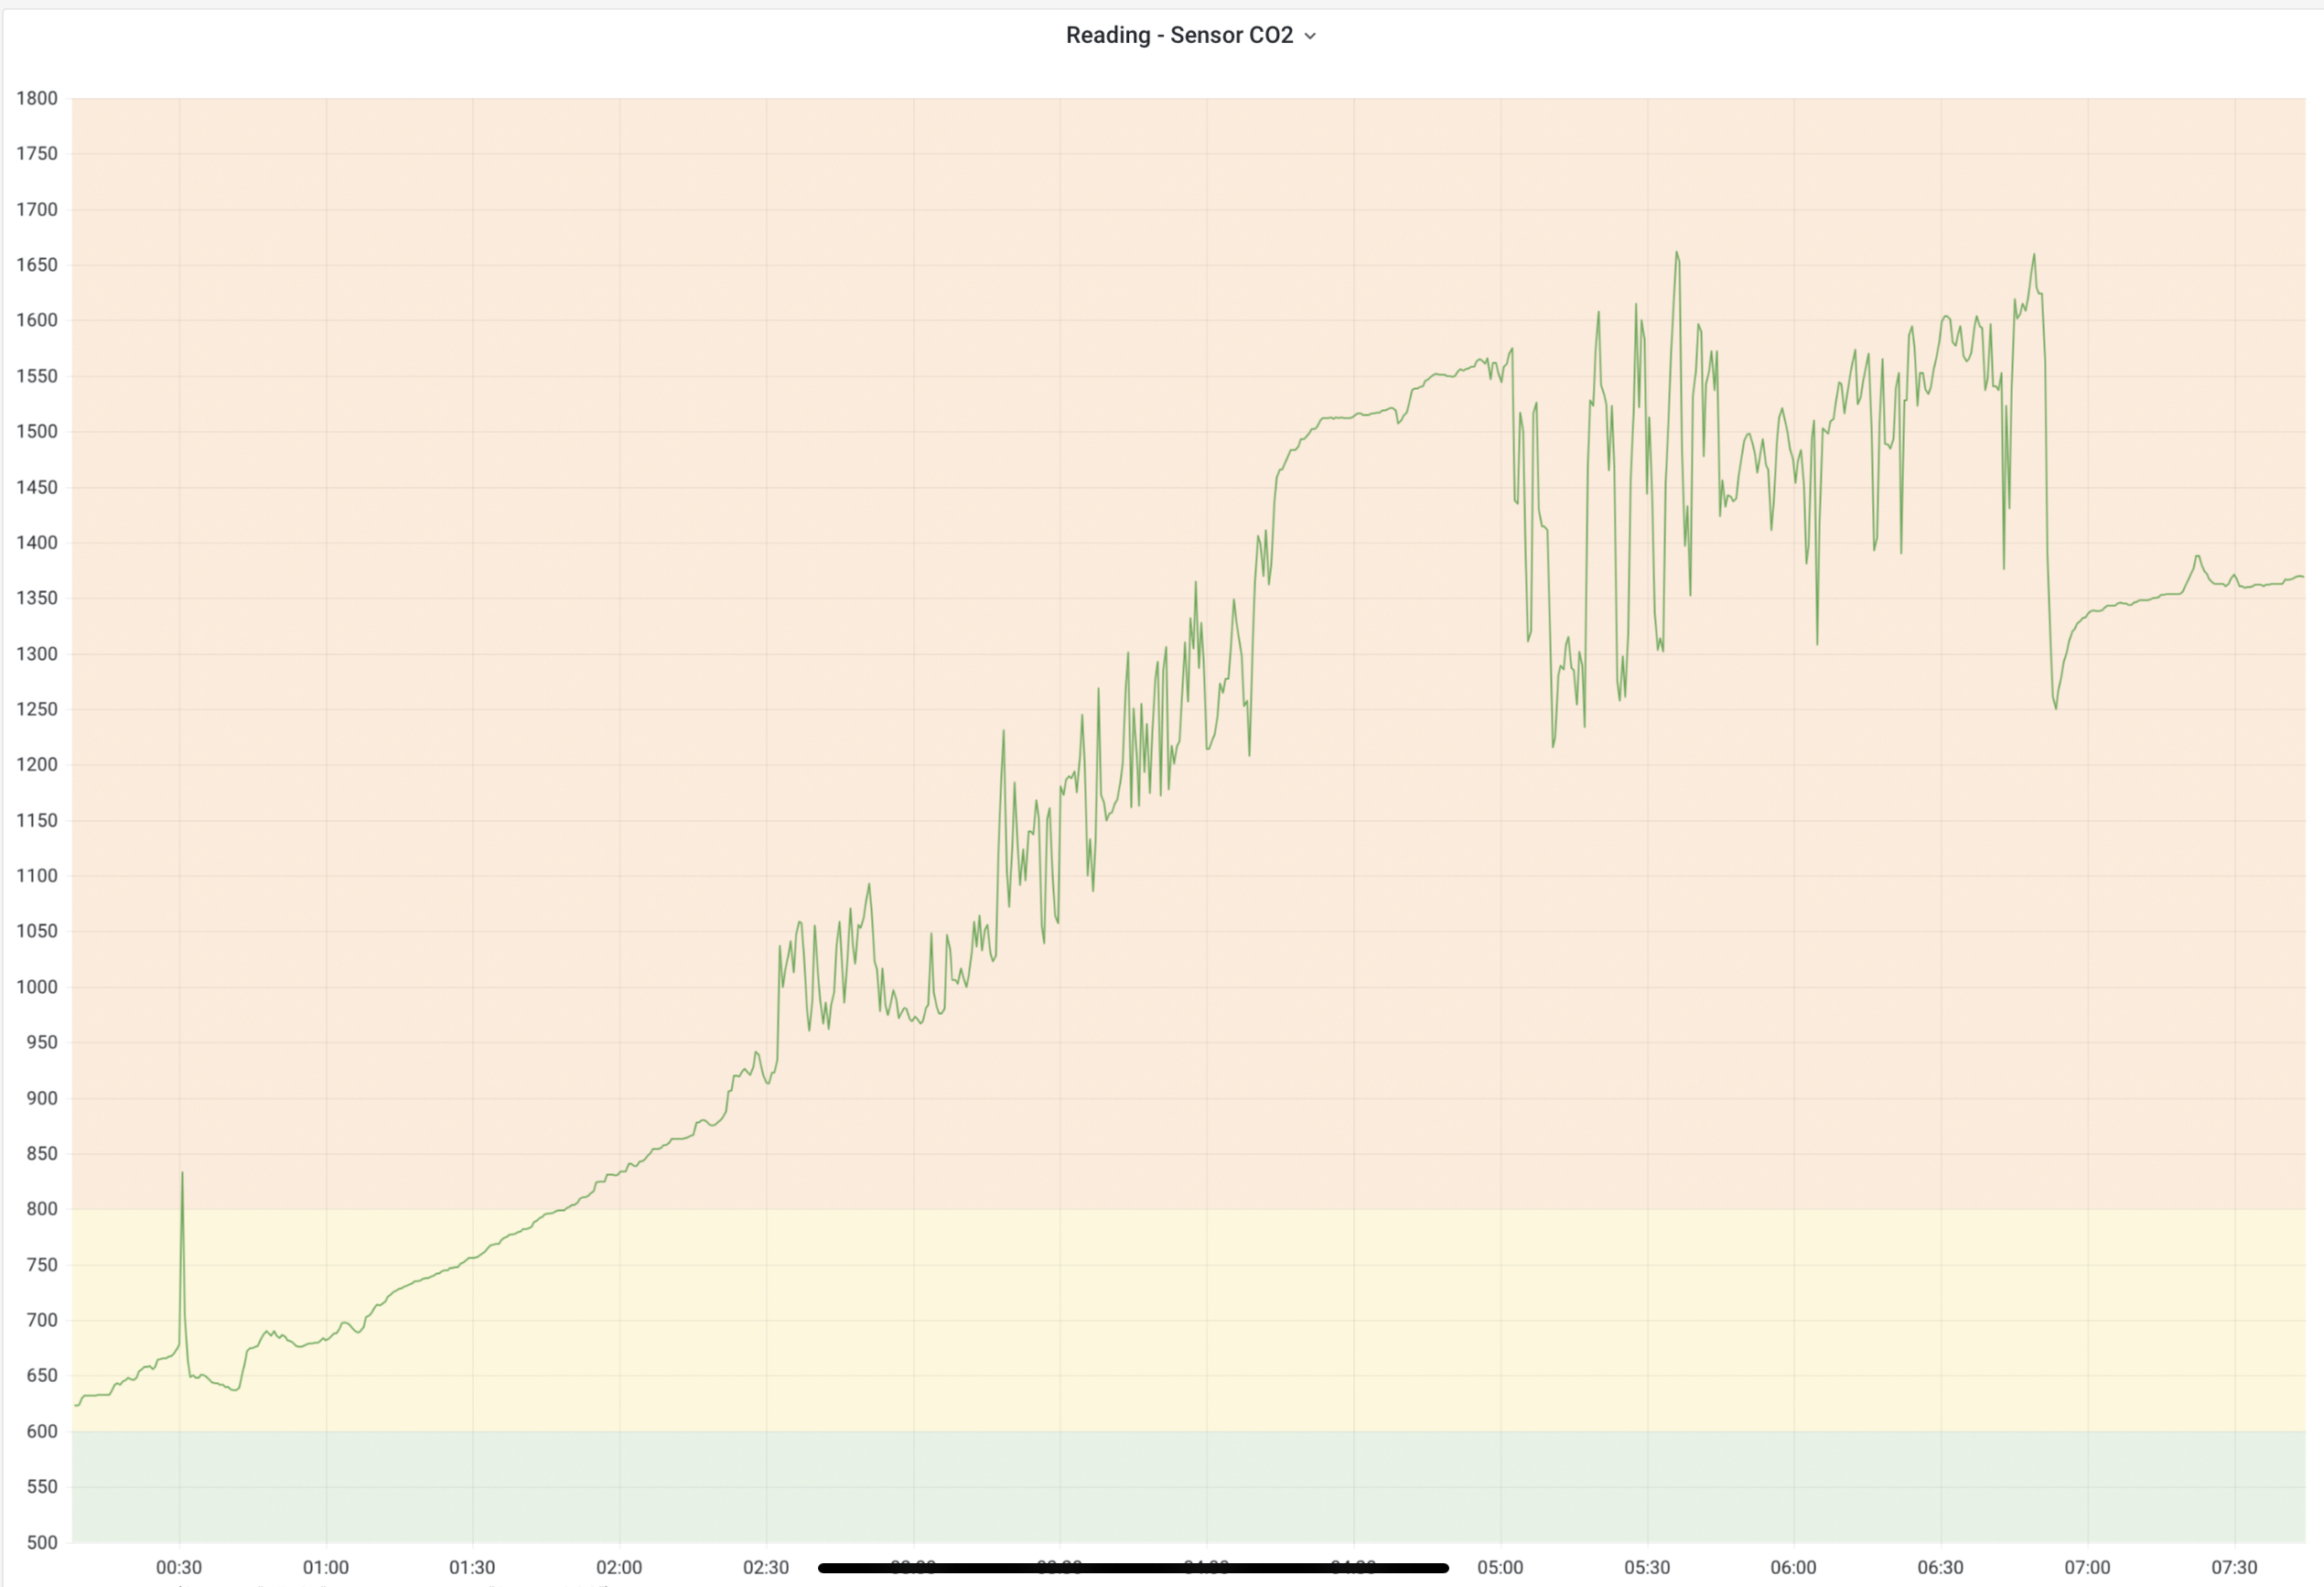
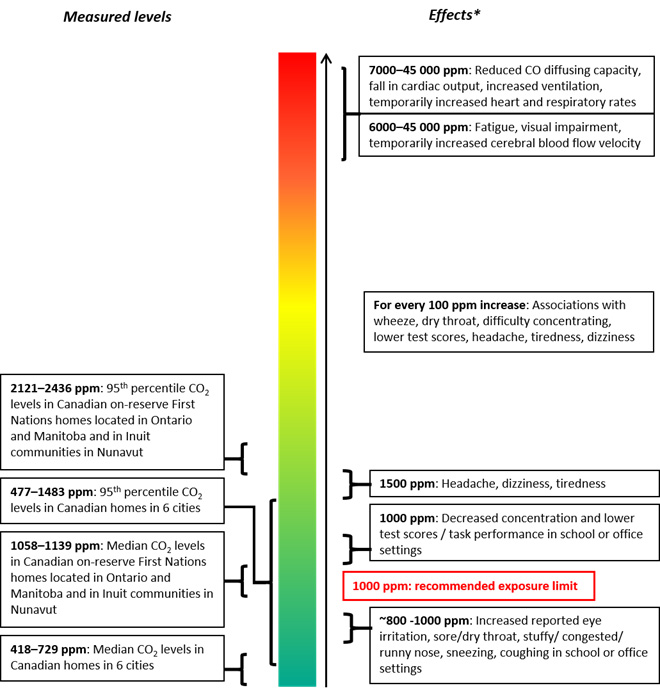
From my overnight readings, CO2 levels in my apartment spike into dangerous territory, so looks like I was right. I’m going to do some research on how to fix this!
It’s 2022, and building air quality monitoring infrastructure is still a hard task. In the future, ingesting locally sourced data from the AQICN project could be a great way to get outdoor readings.
I think there is a big target market for such systems if it was provided at a low cost to consumers. Unfortunately, the economics of providing consumer-level hardware in addition to cloud-based infrastructure don’t work at lower costs. That’s probably why so many companies in this industry disappear. Thankfully, my cloud services won’t suddenly disappear of the internet anytime soon and my hardware won’t be rendered a paperweight by any small company calling it quits.